The Father of ECHAM
Erich Roeckner’s scientific career began with an atmospheric model of Venus. After studying meteorology at the University of Hamburg, he performed doctoral research at the Max Planck Institute for Aeronomy in Katlenburg-Lindau under the supervision of Peter Fabian. In his thesis, Roeckner used a numerical model to investigate the vertical temperature profile of our neighboring planet’s atmosphere (Roeckner 1972). As a visiting researcher at the National Center for Atmospheric Research in Boulder, Colorado, he performed calculations on the facility’s supercomputer for this purpose.

From the atmosphere of Venus to the atmosphere of Earth
After completing his doctorate in 1972, Roeckner returned to studying the Earth’s atmosphere when he joined Günter Fischer’s Theoretical Meteorology research group at the University of Hamburg's meteorological institute. Through the work of Fischer, Roeckner, and others, the first Hamburg atmospheric model of the northern hemisphere, which ran in climate mode, was developed (cf. von Storch, Claussen, Gräbel 2018). This meant that many processes that were irrelevant to weather forecasting, but important for climate simulations, had to be plausibly represented. Roeckner focused on parameterizing clouds and used the model to analyze their response to global warming (Roeckner et al. 1987, Roeckner 1988). Clouds remained a focus throughout his career, including in his habilitation thesis in 1989 (Roeckner 1989).
In 1975, the newly founded Max Planck Institute for Meteorology (MPI-M) moved into the Geomatikum, a newly built high-rise building of the University. MPI-M founding director Klaus Hasselmann aimed to develop quasi-realistic, coupled atmosphere-ocean models. With the prospect of a supercomputer, this endeavor began to take shape in the early 1980s. At the institute, Hasselmann’s colleague Ernst Maier-Reimer had been developing numerical models of ocean circulation since 1978 (cf. von Storch, Claussen et al. 2025). When it came to the atmospheric component, collaborating with colleagues from the university who were based in the same building seemed like the obvious choice. Hasselmann networked with Fischer’s group, convincing them to replace the dynamical core of their atmospheric model—that is, the solution methods for the fundamental dynamical equations—with the dynamical core of the weather forecast model from the European Centre for Medium-Range Weather Forecasts (ECMWF). In an interview with Hans von Storch, who conducted research in Fischer’s group and later at the MPI-M, Hasselmann recalled how the decision came about:
“ECMWF was producing the world-best global medium-range weather forecasts on an operational basis and had at that time the leading general circulation model of the atmosphere. It had a large group of experts working on the model. It was quite obvious that it was rather a waste of time to have excellent people like Günter Fischer and Erich Roeckner trying to compete with this large group, trying to do the same thing. So the obvious thing was to take the ECMWF experience and to improve upon it using one’s own expertise. (…) After Günter Fischer’s retirement, Erich Roeckner moved to the MPI, where he developed the original ECMWF model into the—in our view—world-best climate model, under the later directorship of Lennart Bengtsson.” (von Storch 2022, pp.69)
This model was named ECHAM.
Development of ECHAM in the Bengtsson department

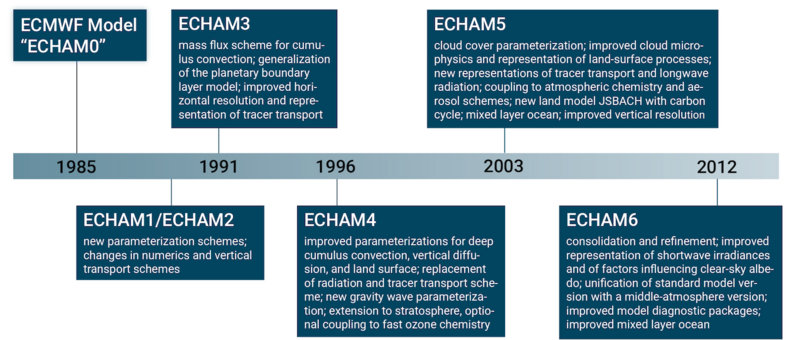
Bengtsson, formerly director of the ECMWF and a co-developer of its atmospheric model, joined the MPI-M toward the end of 1990 to establish a department for “Theoretical Climate Modeling.” The team’s offices were located in the T-shaped temporary “Pavillon” building on a lawn in front of the Geomatikum. Behind mostly closed doors, Roeckner continuously worked on the further development and the “tuning”—that is, the adjustment of the model parameters—of ECHAM. The development work included, among other things, increasing the horizontal and vertical resolution and the resulting necessary readjustment of the model, the development of new parameterizations as well as the improvement of existing ones, the addition of processes, and the coupling with other model components.
Monika Esch, a scientific programmer at the MPI-M since 1991, recalls that coupling ECHAM with MPI-M’s ocean models—first with LSG and later with OPYC and HOPE—was quite challenging. But the effort was worth it. “When I started at MPI-M, Erich and his colleagues had just worked around the clock for several weeks investigating the impact of burning oil wells in Kuwait on the climate.” There had been concern that shading from soot particles released into the atmosphere by large-scale fires could cause significant global cooling. However, in the 1991 Hamburg modeling study, led by Stephan Bakan and based on ECHAM/LSG, this concern was shown to have been unnecessary (Bakan et al. 1991).
“Fast is slow”

Even during such hectic and stressful times, Erich Roeckner never lost his composure. “Erich always said, ‘Fast is slow,’” recalls MPI-M employee Renate Brokopf, who created visualizations of simulations for Roeckner, her former supervisor’s motto. Many former colleagues particularly remember Erich Roeckner’s calm, level-headed, and friendly nature. “Even under the greatest stress, he never put any pressure on us, and he never uttered an unkind word,” says Monika Esch, who worked with Roeckner throughout his entire time at MPI-M. He responded to mistakes made by his colleagues with his characteristic, subtle sense of humor. For example, when presented with a simulation in which the planet was completely frozen due to a missing factor, Roeckner commented: “A very intriguing experiment.”
Nevertheless, Roeckner was also known for his accurate and meticulous work. He did not allow the model’s rapid success to deter him from continuously refining and improving it. A journalist from the Süddeutsche Zeitung who visited the MPI-M in 1997 reported that Roeckner was able to quickly list the factors that were still missing from the ECHAM version at that time (von Storch 2022, p. 17/18).
Overall supervision of ECHAM
Marco Giorgetta, who joined Bengtsson’s department as a doctoral candidate in 1992, recalls Bengtsson giving Roeckner a free hand in developing the model. In turn, Roeckner allowed many colleagues to contribute, supported them, and granted them considerable freedom. However, he thoroughly reviewed every new development before incorporating it into the main version of ECHAM. “Everything came together with Erich. He tested everything thoroughly and ultimately gave his approval,” says Giorgetta. Traute Crueger, who was also conducting research at MPI-M at the time, confirms this. “Erich always kept a close eye on his model to prevent errors from creeping in.“
As a result, Roeckner knew his ECHAM model inside and out. “Among the countless model parameters, he could always pinpoint exactly which ones needed adjusting to influence the model’s behavior in a specific way,” Crueger reports. This tuning, which improves the model’s agreement with observations, was his specialty. “He just had a feel for the model,” says Martin Claussen, who worked with Roeckner in Bengtsson’s department and later as a director at the MPI-M. Renate Brokopf recalls that Roeckner always knew exactly what results to expect from an experiment.
A world-renowned atmospheric model
ECHAM quickly gained recognition as an excellent atmospheric general circulation model. Using coupled model versions, researchers at MPI-M conducted various widely cited studies on topics such as the El Niño climate phenomenon, aerosols, cloud microphysics, and the human influence on the climate (e.g., Lohmann & Roeckner 1996, Roeckner et al. 1999, Roeckner et al. 2006, Timmermann et al. 1999). The model was later successfully coupled with the land model JSBACH, and ECHAM became part of the Earth system model MPI-ESM (Stevens et al. 2013), enabling the first simulation of the complete Earth system over 1,200 years (Jungclaus et al. 2010), among other things. Roeckner played a key role in many of these studies.
From 1990 onwards, the MPI-M participated in the Atmospheric Model Intercomparison Project (AMIP) with ECHAM, a project that aims to evaluate atmospheric models. The MPI-M later contributed its coupled models to the Coupled Model Intercomparison Project (CMIP), whose results were incorporated into the reports of the Intergovernmental Panel on Climate Change (IPCC). “ECHAM has always been among the top models,” says Monika Esch.
Rarely in the spotlight, but highly regarded

In 2005, under Roeckner’s leadership, the MPI-M published climate projections, which were incorporated into the IPCC’s Fourth Assessment Report two years later (IPCC 2007). Roeckner contributed to this report as an author. In this context, the otherwise quiet researcher appeared in the media several times. He clearly and patiently explained to the press how climate models work and what the projections mean. “That was quite special,” says Esch, precisely because Roeckner did not actively seek the spotlight.
MPI-M Director Bjorn Stevens, who first became involved in Hamburg’s climate research in part through Roeckner, formalizes the ratio between accomplishment and recognition as the “Gates number,” which he named after the equally modest researcher Larry Gates. According to Stevens, Roeckner had “an astronomical” Gates number—in other words: Roeckner’s level of recognition is much lower than it actually should be. Yet, those who knew him were well aware of his achievements. The European Geoscience Union aptly described him as the “Father of ECHAM” when they awarded him the Vilhelm Bjerknes Medal in 2006.
Erich Roeckner’s influence on climate research, however, is evident not only in what he contributed but also in how he did it. Colleagues from across several decades speak of Roeckner’s expertise and his pleasant personality in the same breath. “His modest, wise manner left a lasting impression on everyone who knew him,” says MPI-M director Jochem Marotzke. “Roeckner’s influence continues to be felt at the institute and will remain with us in the future.”

Credit: MPI-M
Active after retirement

After the start of his retirement on January 1, 2007, Roeckner remained at the institute for several more years. He handed over primary responsibility for ECHAM to Marco Giorgetta and Thorsten Mauritsen (now University of Stockholm). With the development of the ICON model, which he himself had helped initiate, a successor model for ECHAM and the MPI-ESM was already under development.
He knew how to use his newfound time productively: “Now I finally have time to find the errors that I am still suspecting in the model,” he told his colleague, Monika Esch. However, Roeckner did not limit himself to—successful—error detection during this time. In the ENSEMBLES project, he and his team calculated emission pathways compatible with the 2-degree target, which represented a prototype for a new type of model experiment that was ultimately integrated into CMIP5 (Roeckner et al. 2011).
On the occasion of his retirement from active service, the MPI-M organized a symposium in September 2009 on Roeckner’s favorite topic: clouds. Unsurprisingly, ECHAM appeared in the titles of many of the presentations and posters. The opening lecture was given by Roeckner’s doctoral advisor, Peter Fabian. The title matched Roeckner’s scientific career quite well: “From Venus to Earth.“
Contact
Prof. Dr. Jochem Marotzke
Managing Director, Max Planck Institute for Meteorology
jochem.marotzke@mpimet.mpg.de
Dr. Denise Müller-Dum
PR and Communication Officer, Max Planck Institute for Meteorology
denise.mueller-dum@mpimet.mpg.de
References
- Bakan S., et al. (1991) Climate response to smoke from the burning oil wells in Kuwait. (1991) Nature 351, 367–371. DOI: 10.1038/351367a0
- IPCC, 2007: Climate Change 2007: The Physical Science Basis. Contribution of Working Group I to the Fourth Assessment Report of the Intergovernmental Panel on Climate Change [Solomon, S., D. Qin, M. Manning, Z. Chen, M. Marquis, K.B. Averyt, M. Tignor and H.L. Miller (eds.)]. Cambridge University Press, Cambridge, United Kingdom and New York, NY, USA, 996 pp. https://www.ipcc.ch/site/assets/uploads/2018/05/ar4_wg1_full_report-1.pdf
- Jungclaus, J. H., Lorenz, S. J., Timmreck, C., et al. (2010) Climate and carbon-cycle variability over the last millennium, Clim. Past, 6, 723–737, DOI: 10.5194/cp-6-723-2010
- Lohmann, U., & Roeckner, E. (1996). Design and performance of a new cloud microphysics scheme developed for the ECHAM general circulation model. Climate Dynamics, 12, 557-572. DOI: 10.1007/s003820050128.
- Roeckner E. (1972) Temperaturberechnung der Venusatmosphäre bis 80km Höhe aufgrund solarer und thermischer Strahlungsströme sowie konvektiver und turbulenter Wärmetransporte. Mitteilungen aus dem Max-Planck-Institut für Aeronomie Nr. 46. https://link.springer.com/chapter/10.1007/978-3-642-65360-5
- Roeckner E. (1988) Cloud-Radiation Feedbacks in a Climate Model. Atmospheric Research 21, 293–303. DOI: 10.1016/0169-8095(88)90032-4
- Roeckner, E. (1989) Wolken und Klima: Modellierung und Feedback-Analysen. Hamburger Geophysikalische Einzelschriften, Heft 92, Hamburg 1989.
- Roeckner, E., Schlese U., Biercamp, J., Loewe P. (1987) Cloud optical depth feedbacks and climate modelling. Nature 329, 138–140 (1987). DOI: 10.1038/329138a0
- Roeckner E. et al. (1992) Simulation of the present-day climate with the ECHAM model: Impact of model physics and resolution. Max-Planck-Institut für Meteorologie, Report. No. 93. http://hdl.handle.net/11858/00-001M-0000-0014-A078-C
- Roeckner E., Arpe L., Bengtsson L. et al. (1996) The Atmospheric General Circulation Model ECHAM-4: Model Description and Simulation of Present-Day Climate. Max-Planck-Institut für Meteorologie, Report. No. 218. http://hdl.handle.net/11858/00-001M-0000-0013-ADE3-C
- Roeckner, E., Bengtsson, L., Feichter, J. et al. (1999) Transient Climate Change Simulations with a Coupled Atmosphere-Ocean GCM Including the Tropospheric Sulfur Cycle. Journal of Climate, Vol. 12, 3004–3032. doi: 10.1175/1520-0442(1999)012<3004:TCCSWA>2.0.CO;2.
- Roeckner, E., Stier, P., Feichter J. et al. (2006) Impact of carbonaceous aerosol emissions on regional climate change. Climate Dynamics 27: 553–571. DOI: 10.1007/s00382-006-0147-3
- Roeckner, E., Giorgetta, M., Crueger, T. et al. Historical and future anthropogenic emission pathways derived from coupled climate–carbon cycle simulations. Climatic Change 105, 91–108 (2011). DOI: 10.1007/s10584-010-9886-6
- Stevens, B., Giorgetta, M., Esch, M. et al. (2013) Atmospheric component of the MPI-M Earth System Model: ECHAM6, JAMES, 5, 146–172, DOI: 10.1002/jame.20015.
- Timmermann, A., Oberhuber, J., Bacher, A. et al. Increased El Niño frequency in a climate model forced by future greenhouse warming. Nature 398, 694–697 (1999). DOI: 10.1038/19505
- von Storch, H. (2022) From decoding turbulence to unveiling the fingerprint of climate change: Klaus Hasselmann—Nobel Prize Winner in Physics 2021. Springer. DOI: 10.1007/978-3-030-91716-6
- von Storch, H., Claussen, M., Gräbel, C. (2018) Zur Geschichte der Klimaforschung in Hamburg. 20. Februar 2018, http://www.hvonstorch.de/klima/pdf/180226.Klima.HH..final.pdf
- von Storch, H., Claussen, M., Heimann, M., Sausen, R., Zorita, E. (2025) Climate Science Concepts Born in Hamburg. Springer, DOI: 10.1007/978-3-031-81108-1