With the award, the “SC21: International Conference for High Performance Computing, Networking, Storage, and Analysis” acknowledges the year’s most impressive videos in high-performance computing. The videos are judged based on overall quality, how they illuminate science, and on creative innovations in the production process.
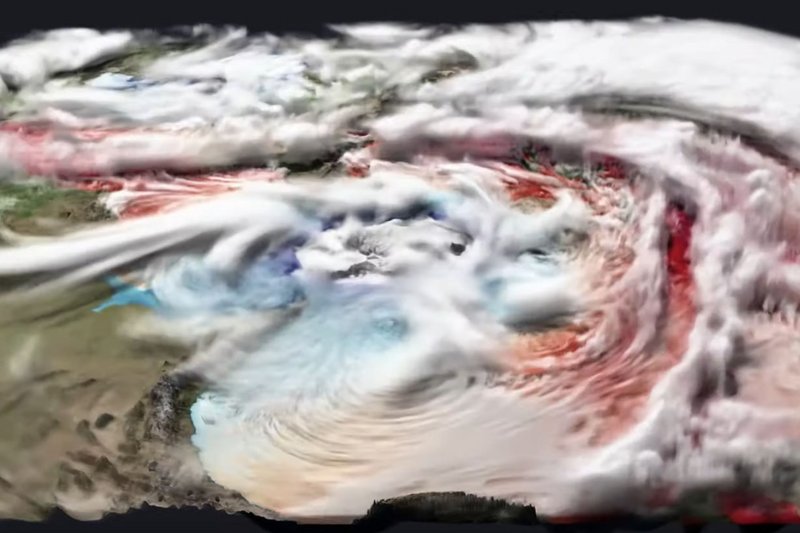
Climate simulations are one of the most data intensive scientific disciplines. This year´s winning team has performed a coupled storm-resolving simulation using the globally coupled Earth system model ICON-ESM. It allows global simulations at a resolution of 5 km to study a wide range of Earth’s weather and climate phenomena. The visualization shows the time varying 3D ocean and atmospheric data such as sea surface pressure and 10 m wind, sea surface velocity and sea ice, clouds as composition of liquid cloud water and cloud ice, sea surface temperature, and sea temperature.
The simulation was running for one model year, from which the team chose the months May, June and July for visualization. Unlike the majority of global climate visualizations, they chose the unique view of a Spilhaus projection. It puts the oceans into the center and visualizes them as one body of water, without cut outs, clipping planes and with only minor distortions. The team thereby focuses on 3D atmospheric and 3D ocean data, and the interaction between these realms.
The data used for the visualizations stems from ICON-Sapphire and the ESiWACE project; Niklas Röber of the German Climate Computing Centre created the visualization and presented it at the conference. The data was visualized using the data analysis and visualization application ParaView 5.7.1. The rendering was performed using Intel OSPRay, one of the two raytracing back ends available in ParaView.
Further information:
Description of the video (PDF)
Presentation video
Visualization video
Contact:
Prof. Dr. Bjorn Stevens
Max Planck Institute for Meteorology
Email: bjorn.stevens@mpimet.mpg.de
Michael Böttinger
German Climate Computing Centre (DKRZ)
Email: boettinger@dkrz.de