The hiatus in global temperature trends: No systematic error in climate models

Professor Jochem Marotzke, Director at the MPI-M, and his colleague, Professor Piers Forster from the University of Leeds, UK, determine in their recent publication in Nature for the first time to what extent the simulated global temperature trends of the past depend on the most important plausible causes. These are the forcing such as from increased greenhouse-gas concentrations, the sensitivity of climate to changes in the forcing, the heat uptake by the ocean, and spontaneous climate variability (which arises from chaotic processes in the climate system and hence cannot be attributed to any particular cause). Explanations of simulated spread of past temperature, obtained this way, hold crucial information on why simulations and observations differ.
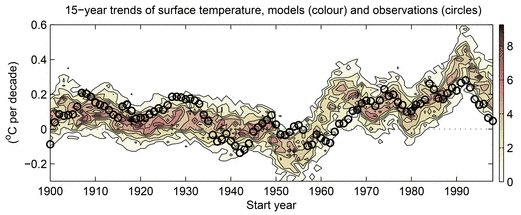
The authors proceed in two steps. First, they compare simulated and observed 15-year trends over the entire period from 1900 to 2012 (Figure 1). This provides the context for the particular period from 1998 to 2012. This latter period witnessed some extreme regional climate trends, such as a strong cooling in central Siberia during winter and an unparalleled strengthening of the trade winds in the Pacific causing cold ocean water to reach the surface. Such random extreme events are very rare and are hard to reproduce with models - just as three dice show a sum of "three" only very rarely. And because trends over a period of 15 years, which is very short in the climate context, are strongly influenced by random events, simulated 15-year trends must be compared with observations for as many periods as possible to obtain a robust assessment of their quality.
Figure 1 compares, for all possible 15-year trends since 1900, the observations with all 114 available simulations. A start year of 1900 means that the trend is computed over the period from 1900 to 1914, a start year of 1901 that the trend is computed over the period 1901 to 1915, and so on. For each start year the colour shading indicates how frequently a particular trend size appears in the ensemble of simulations. Compared with the simulations, the observed trends are distributed in no discernibly preferred way and occur sometimes at the upper end of the ensemble and sometimes at the lower end of the ensemble. The simulated trends are thus broadly consistent with the observations.
In a second step, the authors investigate the causes of the ensemble spread of the simulations. To this end, they isolate with the help of a statistical approach (multiple linear regression) the contributions of individual processes. Theoretical considerations suggest that the spread in temperature trends should depend on the trends in radiative forcing, on the sensitivity of climate in the individual models, and on the efficiency of oceanic heat uptake in the individual models. For example, the sensitivity of climate in the individual models varies by a factor of three (between 0.6 and 1.7 °C warming for each W/m2 in radiative forcing; note that a doubling of the CO2 concentration in the atmosphere is expected to produce a radiative forcing of a little under 4 W/m2 in radiative forcing). If indeed too high model sensitivity were responsible for the too large temperature trend of the past 15 years, the models with a high sensitivity should systematically show a larger temperature trend than the models with a lower sensitivity.
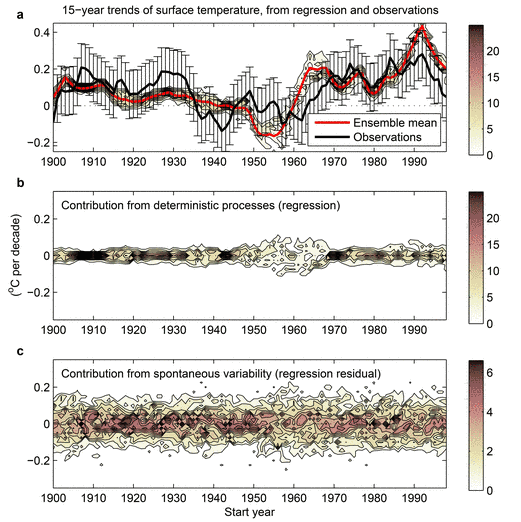
The contributions by the three processes (trend in radiative forcing, sensitivity of climate, efficiency of oceanic heat uptake) are collectively interpreted as deterministic contributions to ensemble spread. The regression residual, which is the amount of ensemble spread that cannot be explained through deterministic contributions, is interpreted as the contribution by spontaneous climate variability. Analogously to Figure 1, the regression analysis is performed for all available 15-year trends since 1900, to obtain as robust a result as possible.
For all 15-year trends in surface temperature since 1900, deterministic effects contribute much less to ensemble spread than does spontaneous variability (Figure 2b,c). This confirms that random spontaneous climate variability dominates the differences between individual simulations as well as the differences between observations and simulations. This last statement can be quantified by constructing from Figure 2c a model-based estimate of the uncertainty arising from spontaneous variability. If this uncertainty is added to the observations (Figure 2a), the entire simulated ensemble lies within the range of observations plus uncertainty, for almost all start years. Exceptions arise for only a few start years that show temperature trends strongly influenced by strong volcanic eruptions, as well as the last two or three start years that, as mentioned above, were marked by climatic extreme events.
In summary, for the globally averaged surface temperature over the entire period from 1900 to 2012, the simulated 15-year trends show no systematic deviation from the observations. The differences between simulated and observed trends are dominated by spontaneous climate variability. In particular, the sensitivity of climate in the models plays no role in the difference between simulations and observations. This latter fact occurs although sensitivity varies across models by a factor of three. The claim that climate models systematically overestimate the warming caused by increasing greenhouse-gas concentrations therefore seems to be unfounded.
Original paper
Marotzke, J., and P.M. Forster, 2014: Forcing, feedback and internal variability in global temperature trends. Nature, 517, 565-570, DOI 10.1038/nature14117.
Contact
Professor Jochem Marotzke
Max Planck Institute for Meteorology
Phone: +49 40 41173 311 (Assistant Kornelia Müller)
Email: jochem.marotzke@mpimet.mpg.de
Professor Piers Forster
School of Earth and Environment
University of Leeds
Phone: +44(0) 113 34 36476
Email: p.m.forster@leeds.ac.uk